by Ralph Eck
| Nov 19, 2013
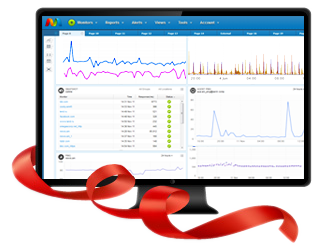 The IT monitoring arena is a very competitive and continually evolving one and we are always looking at ways to improve to meet and exceed clients needs and experiences. We listened to our customers comments and reviewed their wish lists and based on this we are proud to release an all new dashboard. The new dashboard is;
- Simplified, more intuitive layout, menus and flows
- New, faster and more user friendly charts with zoom
- Shared modules –you can embed any monitor to a web page
- Full screen view support
- Monitors collapsed views containing all necessary information
We have taken great care in developing a dashboard that is much more intuitive and provides you with clear menus to easy both your set up process as well as to enhance your ongoing monitoring experience. The specific features we have added include;
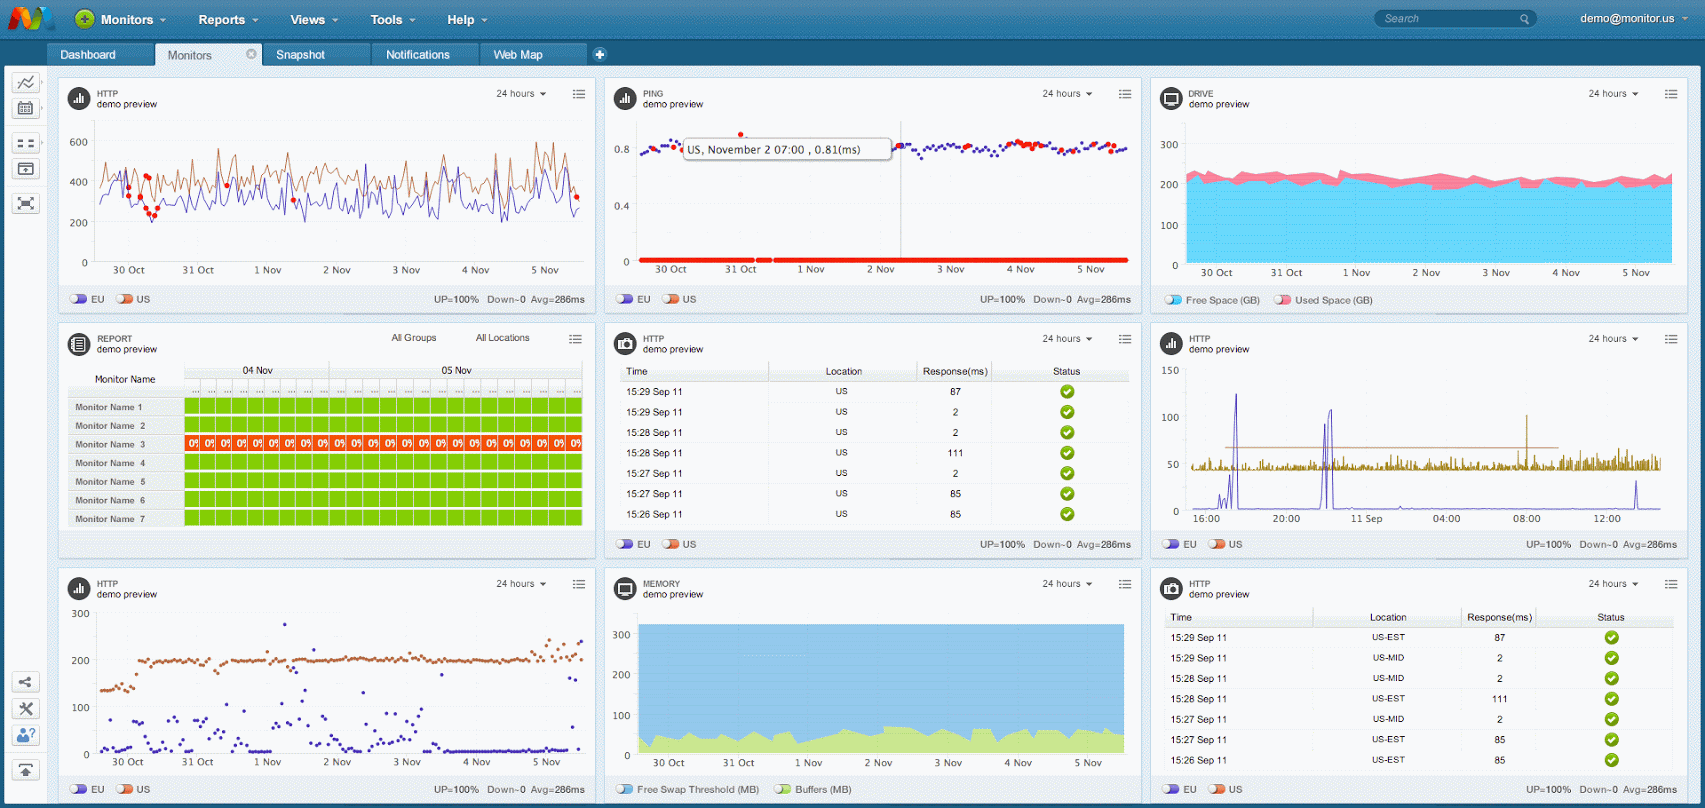
1. Full Screen View – In the new dashboard you have the ability to make your dashboard full screen thus increasing visibility and enabling you to contain more on it without compromising what you see.
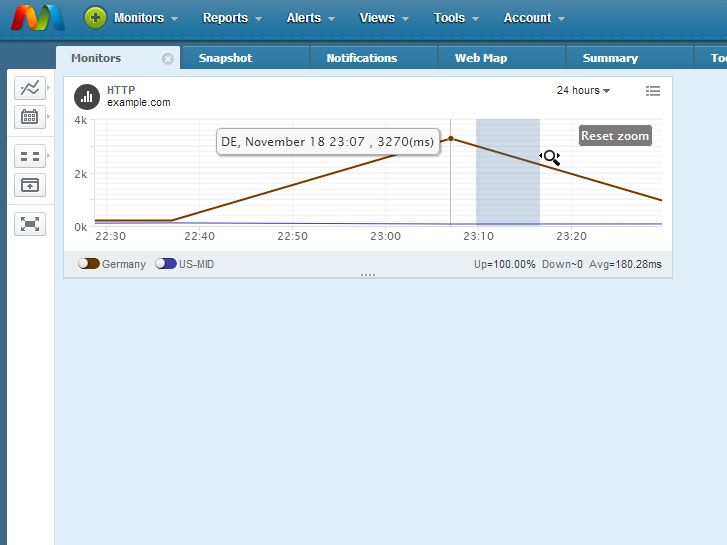
2. Zoom – We have opened up a zoom feature that will enable you to get a “close-up” view of what is in your monitors. Thus you can drill down deeper due to this increased visibility.
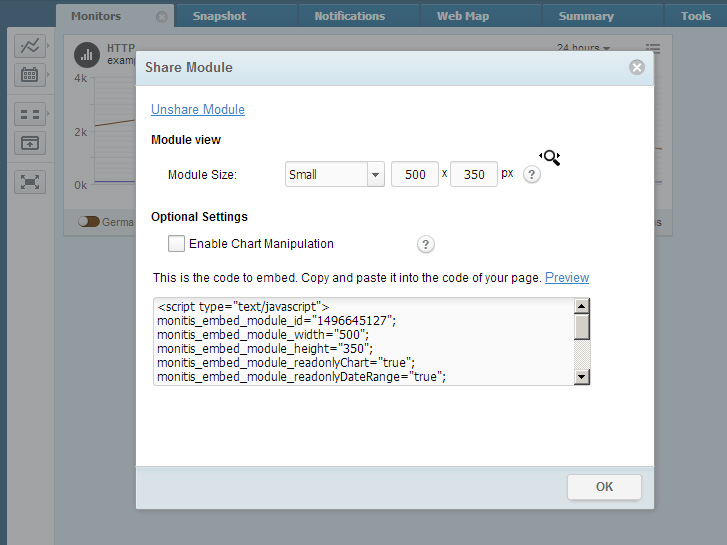
3. Shared Modules – With this functionality you can take your monitors and embed them directly onto your website as you wish. It is a wonderful tool that allows your sites’ visitors to see that you provide fast and efficient service and are serious enough about it to let them see the results of your own monitoring.
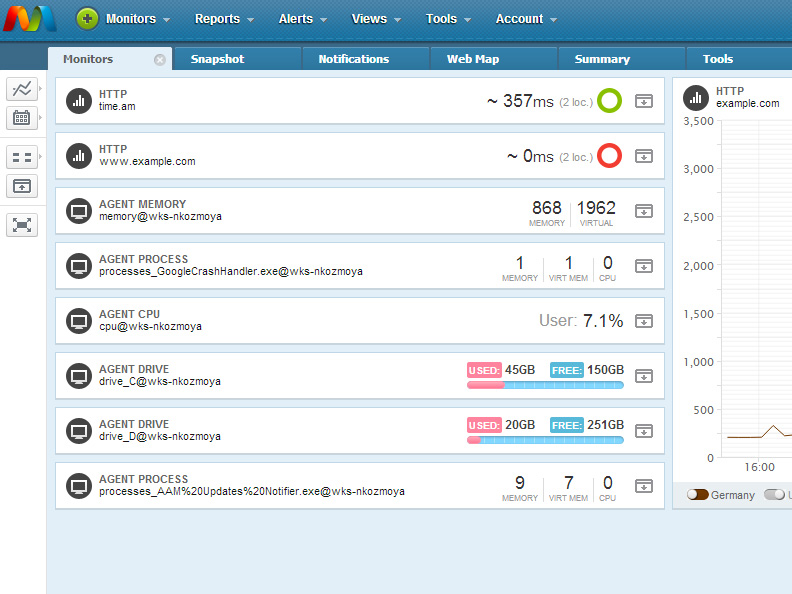
4. Collapsed Views – This allows you to keep your dashboard open but make it more organized by being able to collapse the view of specific monitors. When all is working the icon on the collapsed view is green and if there is a failure it immediately turns red to let you know.
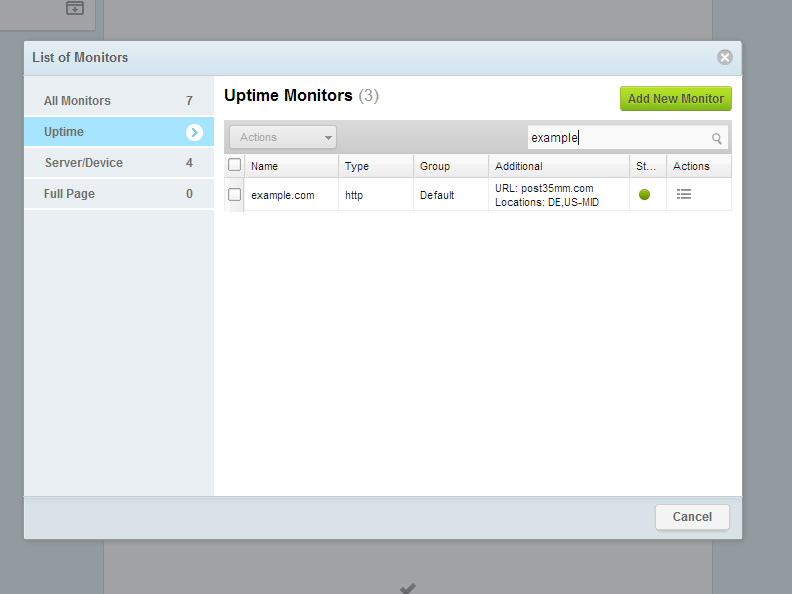
5. List of Monitors – This neat feature is a great aid in helping you both see what you have at a snapshot and help you in managing them. On a single screen you get; a detailed view of the monitors by type, the the quantity of monitors in each type and can also drill down to list you the individual monitors in a type.
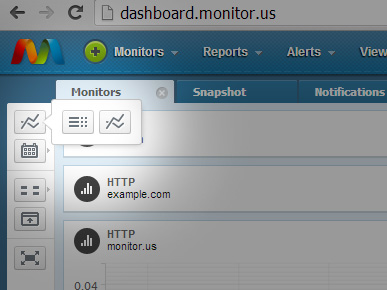
6. Reporting View Bulk Change – This enables you to change, in bulk, the way you want to view a series of your monitors.
7. Supports Local Time Zones in Maintenance setting – This feature lets you set your monitor reporting to not report a failure during a scheduled maintenance window and you no longer need to recalculate your local time to GMT, it is now entered in local hours.
We are sure that you will truly enjoy the new dashboard and the added features. As you start to implement them you will see how they improve your monitoring experience and add increased value to the monitoring you are doing.
Post Tagged with