by Ralph Eck
| Nov 11, 2013
In part 2, we looked at the first two reporting tools in more detail. In this article, the last of the ‘Using Google Analytics for Beginners’ we will wrap up the series by covering everything that remains to be discussed about Google Analytics.
The Overview section has three parts to it, as shown by the images below.
Audience (Continued from Part 2)
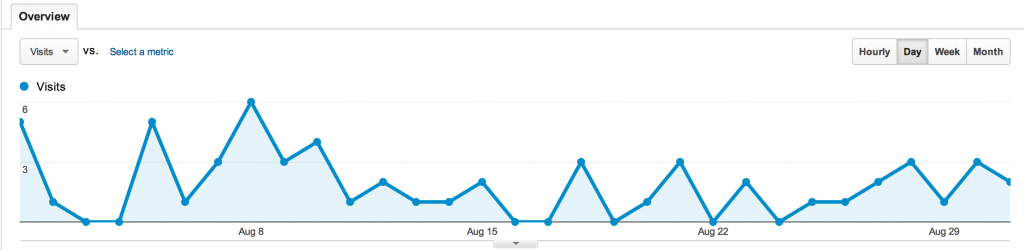
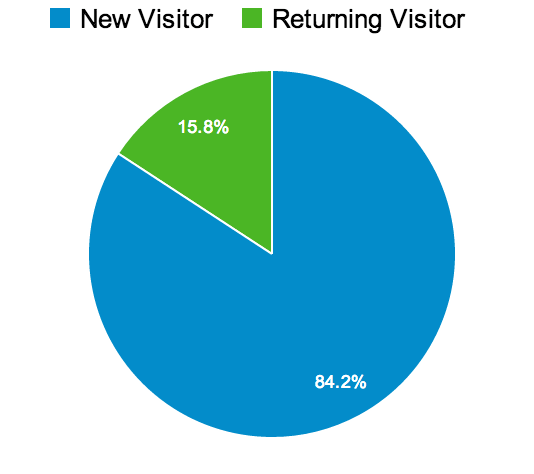 The image above shows the first part of the Overview section within the “Audience” reporting tool of Google Analytics. This first part is about data visualization. The pie charts on the left displays [new: returning] visitor ratio while the line chart shows the number of visitors over a period of a month. You can adjust the data points by choosing hourly, day, week or month. More data points mean more accuracy at any instantaneous point in time.
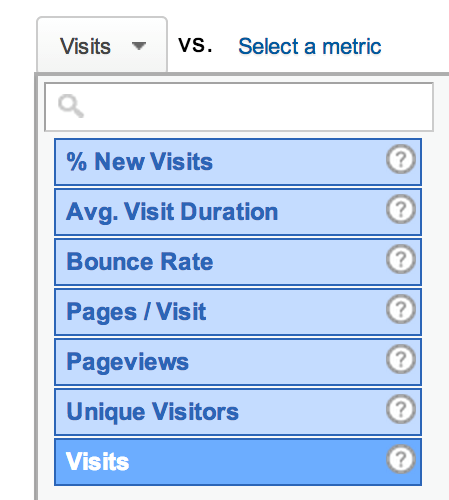
You are flexible enough to feed the metrics you want into the line chart. For example, you can wish to visualize bounce rates, unique visitors or average visitor duration instead of page views (default). The image below shows how you can achieve this by click a simple dropdown.
The second part is all about visitors. Here, you get to see metrics along with their tiny line charts. These metrics are important. Page views and unique visitors pretty much allow you gauge how are things performing. The more the better, and you can use statistics like these to dictate potential advertising fees on your website. Other smaller details include pages/visit, bounces, durations and new visits.
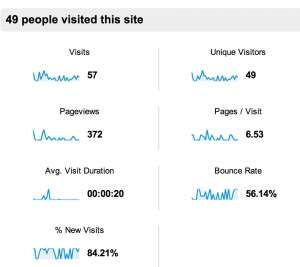
Page views and unique visitors pretty much allow you gauge how are things performing. The more the better, and you can use statistics like these to dictate potential advertising fees on your website. Other smaller details include pages/visit, bounces, durations and new visits.
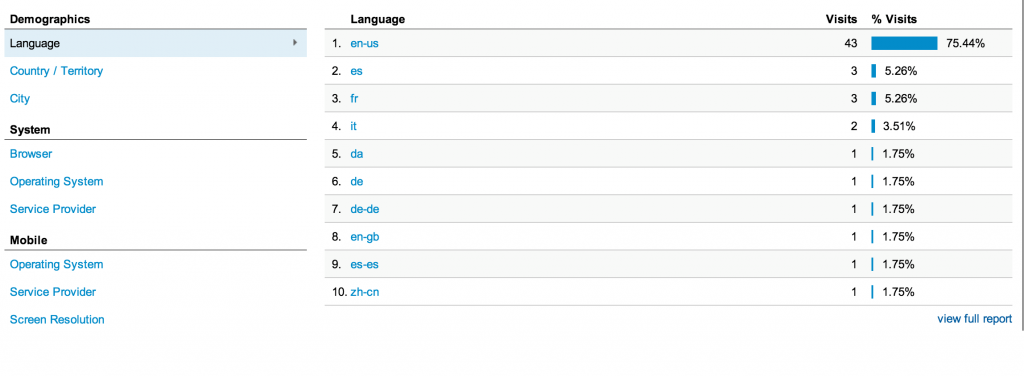
The third part is about demographics, language, system and mobile. This allows you to see where you visitors are coming from, geographically. The system box helps you understand the technology your visitors use to access your website, which includes browser type, ISP and operating system. These technology-based statistics are helpful when it comes to designing websites for the platforms and browsers that your users use the most.
All of this combines to deliver a great user experience. A worthwhile data is the screen resolution section which front-end engineers should be aware of while they are at work. Google Analytics also allows multiple people in a team to access the services. Therefore, it becomes important to distribute information across your IT team, who might use it to create better products, driven by website traffic data.
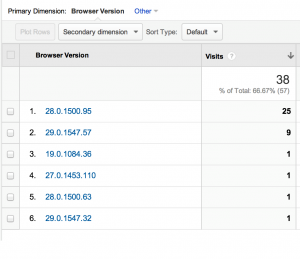 The other section in “Audience” allows you to access the same details available to you in Overview, but in greater detail. For example, you might want to know the specific version of Google Chrome your visitors used to access your site. To access that type of data, you can wish to use the sub features of the “Audience” reporting tool. We will not discuss those sub features in detail to prevent repetitiveness.
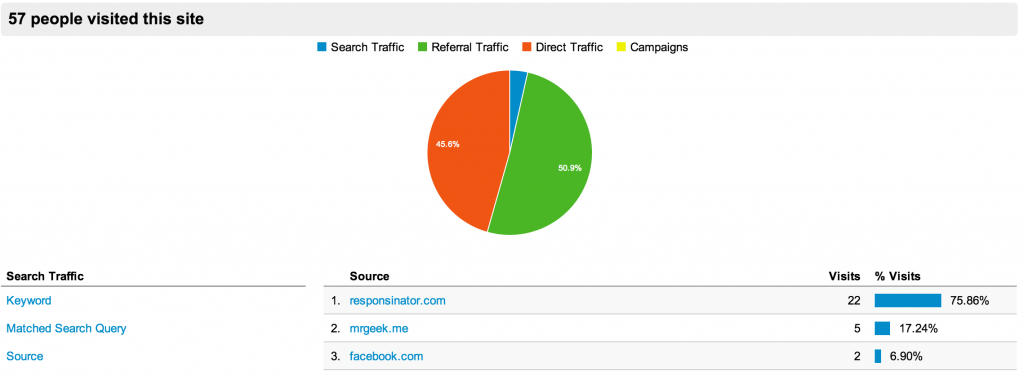
Traffic Sources
The “Traffic Sources” reporting tools allow you to see where do your visitors come from. You can look at the search traffic, the keywords that lead to your site, and a variety of sources like social, direct or referrals. In addition to this, you have sub features within this tool that are made for SEO, like landing pages, query analysis and more.
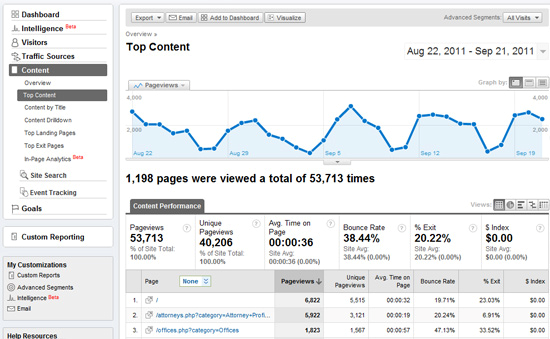
Content
To end this series, we will look at a rather useful reporting tool “Content”. This gives you a deep analysis of the content that your users or visitors look at while accessing your website. This part of the Google Analytics allows you to find hidden gems, your top performing content, top landing and exit pages. If you run a blog, you can use this data to write more of the posts that bring you the highest amount of traffic. This combines to show what works and what doesn’t.
In the end, it is important to realize that Google Analytics is a vast tool, which takes time to learn. It is important to tinker around, explore more of the valuable features by yourself, keeping your online marketing targets in mind. This short series ‘Using Google Analytics for Beginners’ will prove to be a good reference point and a primer into the world of Google Analytics. By now, you must be well equipped to set up, use and monitor your website statistics with this free Google Analytics app that is used by 57% of the top 1 million sites on the planet. Good luck!
Post Tagged with