by Ralph Eck
| Nov 07, 2013
 In part 1 of this series, we introduced you to Google Analytics where we talked about setting it up on your website and showed you the basic dashboard. In this article, we will take the ‘Using Google Analytics for Beginners’ series ahead by discussing the various reporting tools in detail. Without further ado, let’s get started.
Multitude of Reporting Tools in Google Analytics
Google Analytics is a very powerful product for the free service it offers. In fact, the number one reason for its success is the product’s enterprise features at no cost. To be more specific, this powerful web analytics software doesn’t just tell you how many people visited your site on a particular day. It’s more than that. Targeting online marketers of all backgrounds, technical or not, Google Analytics has a range of reporting tools that assist you in devising the right online marketing strategy for your website’s success.
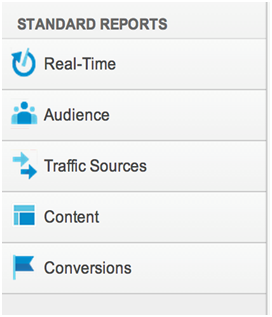 The panel on the left hand side of the Google Analytics UI is a navigation panel that allows you to access the range of reporting tools. At first is a ‘real-time’ monitor which shows you the active number of users on your website at any point in time. Second is an “Audience” reporting tool that basically is what most people will use the Google Analytics service for. The “Audience” section tells you the number of unique visitors, page views, visitor duration, bounce rate and pages per visit statistics. All of these metrics are very important for online marketers. The third is a “Traffic Sources” reporting tool that tells you where your visitors came from. This is very helpful in targeting sources that bring you healthy traffic, and allow you to work on those that don’t. The fourth, is a “Content” reporting tool displays the number of hits that each of the pages or articles got on your website. Last is a “Conversions” reporting tool that allows the user to set up goals and marketing funnels. As traffic data is collected over time, it can display how is your website or online business keeps up with the set goals.
This was a short introduction to the multitude of reporting tools available to you within Google Analytics. Now, we will look into these in more detail to enable you to carry out your online marketing campaigns powered by the statistics at your hand.
Real-time
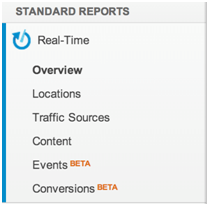 The “Real-time” reporting tools instantly tells you the number of active users reading content on your website. When you click the drop-down, you get to see more sub-features, like locations, traffic sources, content etc. While the Overview section is sufficient to give you an overall view of what’s happening on your site in real-time, you might want to look at specific countries and cities in details. This is what the Locations tab is for. Next up, the Traffic sources section allows you to see the medium, source and active visitors on your site from that specific traffic source. Furthermore, the Content section lets you see the number of active visitors on your site by the page they are on. All of this combined allows you to have a look at your website activity in real-time with greater detail.
Audience
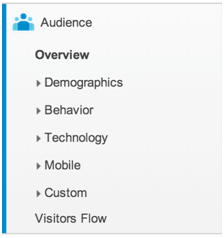 This is the most important reporting tool/facility available to any online marketer using Google Analytics. The statistics displayed in the “Audience” section are what most people use the service for. Knowing your audience through data is of paramount importance in online marketing. The Overview tab gives you snapshot of your website traffic data, like unique visits, hits, pie and line charts for data visualization, demographics and technology. This is a bit hard to understand at first, so we will use an image.
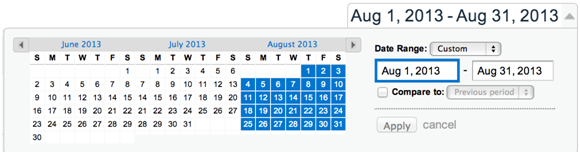
At first, you should decide what period of data do you want to look at, a year, a month, a week or a particular day. The month period is usually recommended as it has enough data for trend charts. Here’s how you can set the period. The image below shows how we can instruct Google Analytics to display data for the period Aug 1, 2013 to Aug 31, 2013. Remember, more data means better results.
That’s it for part 2. Head towards part 3 for more in-depth knowledge on this subject, where we will discuss the “Audience” reporting tool in detail and cover the remaining features of Google Analytics.
Post Tagged with