by Mikayel Vardanyan
| May 22, 2011
monitor.us recently launched something that we think is truly groundbreaking: Free Internal Server and Network Monitoring. Now users of monitor.us, the free web server monitoring service, can download our internal agents onto Windows and Linux servers and monitor CPU, Memory, Disk, Load Average, MySQL, Processes, HTTP, Ping, and even SNMP, for free. Your server could be anywhere in the world and even behind firewalls.
Best of all, since we are a hosted service, all the performance data gets pushed to our cloud and you can access/manage it from anywhere. We hope sysadmins, webmasters, and devops will enjoy a free monitoring service that’s typically very time consuming to setup and maintain.
Here’s how to get started on a Linux machine. The whole process should take no more than 10 minutes. Skilled sysadmins can finish setup in 3 min.
Linux Monitoring Agent Setup Step by Step
-
Login / signup to monitor.us. On your first entry you must see a wizard:
If you disabled the startup wizard then go to Monitors>Add Monitor. On the wizard select Internal Server Monitoring and hit next.

-
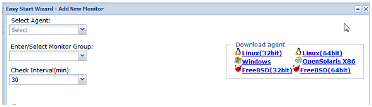
This is the Internal Monitoring Wizard. Select the proper Linux agent on the right. This will download paid-monitor.tar.gz agent file.
-
Place the agent onto your Linux server and follow the instructions to install. First untar the agent file by running “tar -xvvf paid-monitor.tar.gz” in your terminal. Then run “./paid-monitor.sh conf”, enter your monitor.us username, and give the agent a name.

-
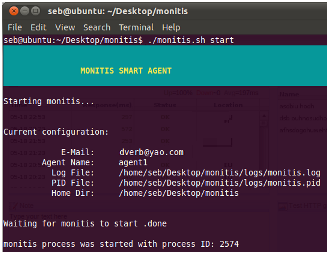
Next run “./paid-monitor.sh start”. The agent should start and show the following information.
- Now go back to monitor.us web dashboard and continue to the Internal Monitoring Wizard as you did in step 2.
-
You should see your installed agent in the combo box. Select the agent you’ve installed and the metrics you’d like to monitor. Now you can select specific metrics to be monitored on that particular server. You can select CPU, RAM, hard disk or process. If you select process you can select any process which is currently active on the server. The wizard provides you with the list of running processes on your Linux server. 
Next, set the thresholds for each metric you have selected, for example CPU <90%. That will generate an alert notification as soon your server’s performance exceeds the threshold. Then click Add.
-
Now you need to setup a notification rule to get alerts. You may skip this and do it later. Simply select a period during which notifications are active, add SMS, email, twitter, or IM contacts, and add a rule for a specific contact.

-
The monitors will be added to your dashboard as movable widgets.
Here’s a graph of CPU utilization over time. You can toggle between Use % and Kernel % and check the performance of separate cores at the bottom.
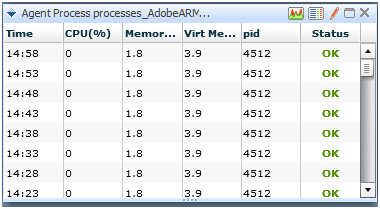
And here’s a Process monitor. It shows the CPU, Memory and Virtual Memory being used by a process. This widget is currently in tabular view, but graphical view is also available at the top right.
Lastly, here’s a Load Average monitor showing load average on my Linux server at 1min., 5min., and 15min. resolutions.

That is it! It should take 5-10 mins to setup and it is much more cheaper and robust than having server in house. A huge advantage is that if we lose connection with your agent because your network or server goes dark, you will still get an alert!

The free internal monitors will do a check every 30 minutes, and there is currently no limit on how many you can add.
Sign Up Now and enjoy free server monitoring!
You can also check our video tutorial:
https://www.youtube.com/watch?v=xOKpfh4GZjw&feature=player_embedded