by Drago Z Kamenov
| Mar 22, 2012
 JBoss is by far the most widely-deployed JEE application server in the industry today. Unsurprisingly,application server administrators and developers are constantly looking for ways to monitor the performance of their applications. Fortunately, at the heart of JBoss lies built-in JMX instrumentation that enables us to collect vital statistics about its internal components. In this series of articles, we will show you how Paid Monitor can help tap into and make sense of the multitude of performance-related metrics available in JBoss.
JMX in a Nutshell
JMX stands for Java Management Extension – a technology which allows application developers to expose management information in a standard way to enable their applications to be managed remotely. Such applications contain a built-in agent (also known as an MBean server), which hosts a number of managed beans, or MBeans for short. Each MBean exposes different attributes and operations that can be accessed or invoked remotely via a generic tool known as a console. A variety of JMX consoles exist, but the most widely used these days is jconsole - a graphical tool bundled with the Java Development Kit (JDK) since version 5.0.
Exploring the JBoss 6.x MBean Ecosystem
The best way to get acquainted with JBoss JMX capabilities up to version 6.1 is to use its built-in web-based JMX console. Make sure your server is up and running, open a web browser and navigate to https://<server_name>:8080/jmx-console. (A word of caution: by default, the JMX console does not require a login. On a production server you would want to secure the JMX console). Once you connect, you will see a page like this:
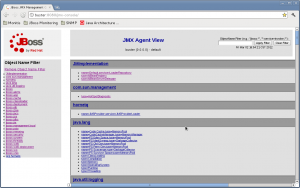
The menu on the left contains links to various JMX domains available on the JMX Server, whereas the Object Name filter box allows us to enter look up MBeans by name. Here are some object name filters to try with their most interesting attributes:
| jboss.web:type=GlobalRequestProcessor,* |
HTTP and AJP Request Processors. These MBeans contain valuable attributes such as:
- bytesSent
- bytesReceived
- processingTime
- errorCount
- requestCount
|
| jboss.web:type=Manager,* |
Web application session manager (one per web application)
- sessionCounter (Total number of sessions created by this manager)
- sessionAverageAliveTime
- sessionMaxAliveTime
- activeSessions
- rejectedSessions – this is the number of sessions that could not be started due to the limit having been reached
- expiredSessions
- maxActiveSessions – maxumum number of allowed sessions
- maxActive – the maximum number of active sessions so far
|
| jboss.web:type=ThreadPool,* |
Thread pools used by the web container. For each thread pool, we have
- currentThreadCount
- currentThreadsBusy
|
| jboss.web:j2eeType=Servlet,* |
Servlets belonging to the various web applications deployed on the server. Important attributes include:
- minTime – Minimum processing time of a request
- maxTime – Maximum processing time of a request
- errorCount
- requestCount – Number of requests processed
|
| jboss.jca:service=ManagedConnectionPool,* |
JDBC database connection pools. This is arguably the most important MBean type exposed by JBoss. Improperly configured connection pools can lead to decreased application performance
- ConnectionCount
- AvailableConnectionCount
- ConnectionCreatedCount (during the lifetime of the pool)
- InUseConnectionCount
- ConnectionDestroyedCount (during the lifetime of the pool)
|
Keep in mind that these are just a small fraction of the MBeans available in JBoss – feel free to explore further.
The Paid Monitor JMX Agent
Paid Monitor includes a dedicated JMX agent which enables you to monitor any JMX-compliant application server, not just JBoss. It is implemented as a JSP application packaged in a .war file. The agent is then deployed to the application server just like any other web application, so you don’t have to worry about setting up cron jobs or running any monitoring scripts manually. What’s even better, it provides an easy-to-use web interface to configure your JMX monitors, so you don’t have to mess with XML configurations files to setup a monitor – it is as easy as point-and-click. Once configured, your monitor configuration is stored in your Paid Monitor account in the cloud.
Installing the Paid Monitor JMX Agent
- Go to https://www.monitor.us and log on to your Paid Monitor account
- From the Monitors tab, choose Manage Monitors -> JMX Monitors. The JMX Monitors window will open:
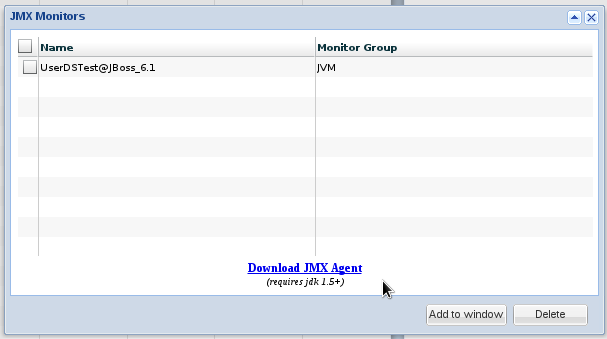
- Click on the “Download JMX Agent” link on the bottom of the screen, and the download will start. Save the mon_jmx_agent.war file on your local machine.
- Copy the .war file to your JBoss server’s deploy folder and make sure your JBoss server is started
- Open up a web browser and navigate to https://localhost:8080/mon_jmx_agent. The login page will appear:
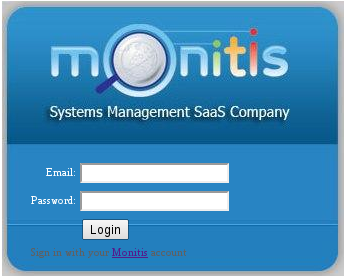
- Use your paid-monitor credentials to log on to the JMX Agent application. While the agent’s user interface runs on your server, it does authenticate remotely against your Paid Monitor account in the cloud.
Setting up a JMX monitor on Paid Monitor
- The application will prompt you to create an agent. The agent will serve as a logical grouping of monitors and their configuration data. You will probably want to create an agent for each JBoss server you want to monitor.

Enter a name for the agent and click Save.
- It is time to configure our first monitor. In our case, we will monitor a JDBC connection pool names UserDS. Click on the Add Monitor link, enter your JMX connection URL in the JMX Service Paramters screen and click Submit:
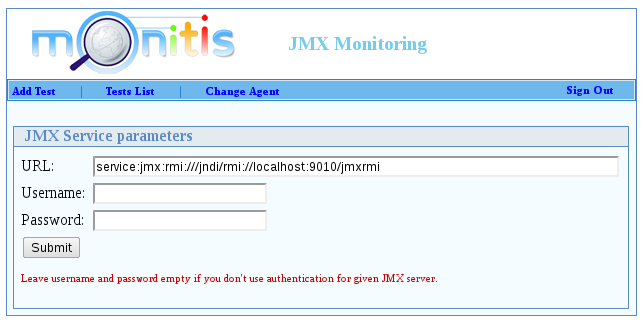
Note: While the default JMX port in JBoss 6.1 is 9010,
Want to give Paid Monitor a try? Signup for a free 15-day trial or explore a wide variety of paid and free monitoring tools.
Post Tagged with