by Drago Z Kamenov
| Feb 22, 2012
 In a previous post we discussed how to improve the performance of BerkeleyDB by tuning the cache size. Let’s see how Paid Monitor can help you keep tabs on the cache hit rate and other critical database metrics. We use a custom monitor created by a perl script,
 monitor_bdb.pl, which can be downloaded from our repository on GitHub. To familiarize yourself with its parameters, run ‘moniror_dbd --help‘. As always, we encourage you to look at the source code to understand its inner workings.
Before we start collecting data, we need to register the new monitor. To do that, invoke the script with the --register option. You have to specify the path to your BerkeleyDB environment and your Paid Monitor-assigned apiKey and secretKey (To find out your specific keys, go to “Tools -> API -> API Keys” menu in the Paid Monitor console):
$./monitor_bdb.pl -register --envDir /path/to/bdb/environment --monitorGroup BDB --monitorName BDB_1 --apiKey '****' --secretKey '*****'
Creating monitor BDB_1 in monitorGroup BDB...

Created monitor with id=2305

Uploading statistics for monitor 2305...
When invoked with the --register option, the script will create a custom monitor in Paid Monitor, collect BerkeleyDB environment statistics, and upload the data to your Paid Monitor account in the cloud. From this point on, to collect data, you should run the monitor script without the ‘--register‘ option. You can use cron or another scheduler to collect and upload data at pre-defined intervals.
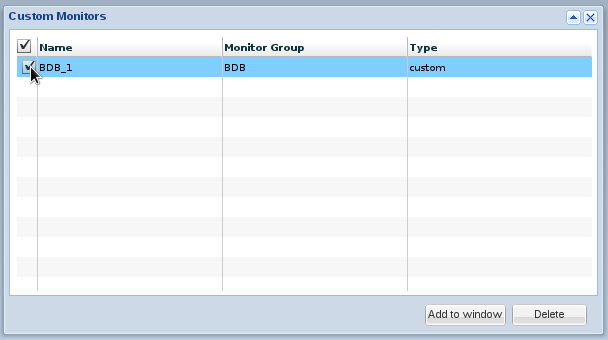
After the monitor has run for a while to accumulate data, log on to Paid Monitor, click Custom Monitors, select the check box next to the new monitor and click Add to Window:
Once the monior window opens, switch to the Line Chart view and select Cache Hit Rate from the selection box on the left to display the graph:
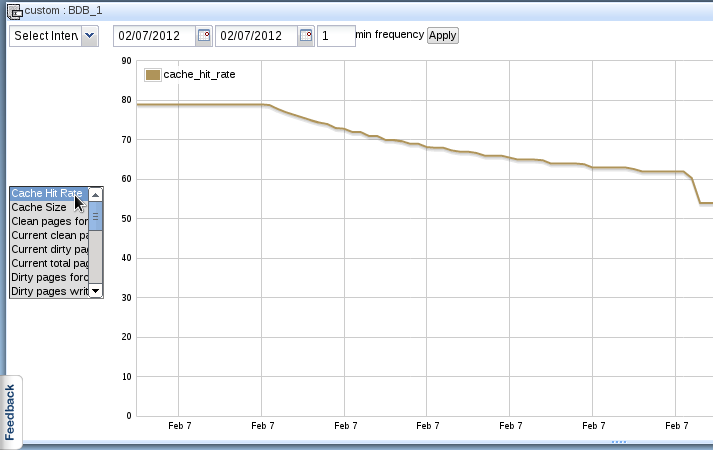
Looking at the graph, it is obvious that the cache hit rate has decreased substantially in a short amount of time. But there is more to Paid Monitor than pretty graphs – it can also alert you if a certain parameter exceeds or falls below a predefined value. In our case, we could create an alert with a threshold of 75% cache hit rate. To do that, click on the pencil icon in the right corner of the window caption to put the monitor window in edit mode and click on the “Notification Rules”: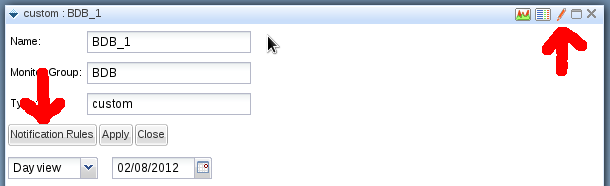
When the Notification Rules window opens, we enter the contact and trigger details and click on the Add Rule button.
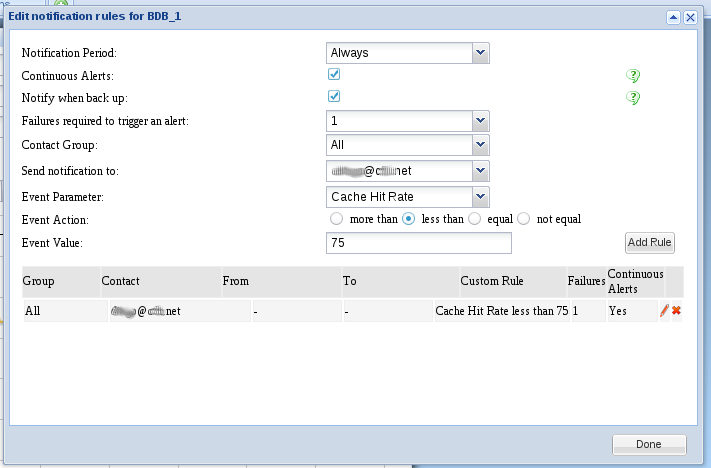
After we click Done, the notification rule will be saved and Paid Monitor will notify you if the cache hit rate falls below your chosen threshold.
That’s all there is to it! The hardest part of using a custom monitor is writing script(s) to register the monitor and to collect and upload the data. Fortunately, Paid Monitor provides an easy to use SDK, with bindings for all popular scripting languages, that makes writing such scripts a breeze – just visit our GitHub repository; where you will also find a library of ready-made monitoring scripts for many popular products.
Post Tagged with